2023年7月16日 星期日

用Pandas來操作百香果交易資料快速又方便

 pandas是一個強大的Python數據分析工具,提供了高效的數據結構和數據操作功能。它被廣泛應用於數據清理、數據轉換、數據分析和數據可視化等領域。

pandas引入了兩種主要的數據結構:Series和DataFrame。

Series是一維的數據結構,類似於帶有標籤的數組,可以容納不同類型的數據。Series提供了方便的索引和選取功能,使得數據操作更加靈活。

DataFrame是二維的數據結構,類似於表格或Excel中的數據。它由多個Series對象組成,每個Series對象代表一列。DataFrame提供了豐富的方法和函數,用於對數據進行操作、過濾、合併和分析。

pandas還提供了許多方便的功能,例如數據的加載和保存、數據的聚合和統計分析、數據的缺失值處理、時間序列數據處理等。

使用pandas,你可以快速載入數據集,對數據進行清理和預處理,進行數據操作和計算,並進行可視化呈現和報告生成。

總結來說,pandas是一個重要且強大的Python數據分析工具,為數據科學家和分析師提供了便利的數據處理和操作能力,幫助他們更高效地進行數據分析和探索。

資料集來源:https://amis.afa.gov.tw/m_fruit/FruitChartProdTransPriceVolumeTrend.aspx

百香果代碼是50和51

下載後,檔名:水果產品交易價量走勢圖資料.ods,檔案內容如下:

把前二列刪除:


注意:記得把資料集的檔案和Python程式檔案放在同一個目錄。

範例一:取出前五筆資料

1
2
3
4
5
6
7
import pandas as pd

# 讀取ODS文件
data = pd.read_excel('水果產品交易價量走勢圖資料.ods', engine='odf')

# 顯示前5行數據
print(data.head())

執行結果:
        交易日期        平均價      交易量
0  112/07/01  53.670853  52451.5
1  112/07/02  52.212767  45936.6
2  112/07/04  50.822808  66436.0
3  112/07/05  46.760777  52604.5
4  112/07/06  46.299146  56520.7

範例二:選擇特定列

 1
 2
 3
 4
 5
 6
 7
 8
 9
10
import pandas as pd

# 讀取ODS文件
data = pd.read_excel('水果產品交易價量走勢圖資料.ods', engine='odf')

# 選擇"交易日期"和"平均價"列
selected_data = data[['交易日期', '平均價']]

# 顯示前5行選擇的數據
print(selected_data.head())

執行結果:
        交易日期        平均價
0  112/07/01  53.670853
1  112/07/02  52.212767
2  112/07/04  50.822808
3  112/07/05  46.760777
4  112/07/06  46.299146

範例三:條件過濾
 1
 2
 3
 4
 5
 6
 7
 8
 9
10
import pandas as pd

# 讀取ODS文件
data = pd.read_excel('水果產品交易價量走勢圖資料.ods', engine='odf')

# 選擇平均價大於50的數據
filtered_data = data[data['平均價'] > 50]

# 顯示過濾後的數據
print(filtered_data)

執行結果:
        交易日期        平均價      交易量
0  112/07/01  53.670853  52451.5
1  112/07/02  52.212767  45936.6
2  112/07/04  50.822808  66436.0

範例四:計算統計數據
 1
 2
 3
 4
 5
 6
 7
 8
 9
10
11
12
13
14
import pandas as pd

# 讀取ODS文件
data = pd.read_excel('水果產品交易價量走勢圖資料.ods', engine='odf')

# 計算平均價的平均值
average_price = data['平均價'].mean()

# 計算交易量的總和
total_volume = data['交易量'].sum()

# 顯示統計數據
print('平均價的平均值:', average_price)
print('交易量的總和:', total_volume)

執行結果:
平均價的平均值: 46.06091497677586
交易量的總和: 719139.8

2023年7月15日 星期六

整合Dajngo和Dash的百香果交易行情展示網站

1.建置虛擬環境

mkvirtualenv passionfruit
pip install django
django-admin startproject passionfruitproj
cd passionfruitproj
python manage.py startapp passionfruitapp


2.編輯settinds.py設定passionfruitapp以及templates的目錄。
  1
  2
  3
  4
  5
  6
  7
  8
  9
 10
 11
 12
 13
 14
 15
 16
 17
 18
 19
 20
 21
 22
 23
 24
 25
 26
 27
 28
 29
 30
 31
 32
 33
 34
 35
 36
 37
 38
 39
 40
 41
 42
 43
 44
 45
 46
 47
 48
 49
 50
 51
 52
 53
 54
 55
 56
 57
 58
 59
 60
 61
 62
 63
 64
 65
 66
 67
 68
 69
 70
 71
 72
 73
 74
 75
 76
 77
 78
 79
 80
 81
 82
 83
 84
 85
 86
 87
 88
 89
 90
 91
 92
 93
 94
 95
 96
 97
 98
 99
100
101
102
103
104
105
106
107
108
109
110
111
112
113
114
115
116
117
118
119
120
121
122
123
124
125
126
127
128
129
130
"""
Django settings for passionfruitproj project.

Generated by 'django-admin startproject' using Django 4.2.3.

For more information on this file, see
https://docs.djangoproject.com/en/4.2/topics/settings/

For the full list of settings and their values, see
https://docs.djangoproject.com/en/4.2/ref/settings/
"""
import os
from pathlib import Path

# Build paths inside the project like this: BASE_DIR / 'subdir'.
BASE_DIR = Path(__file__).resolve().parent.parent


# Quick-start development settings - unsuitable for production
# See https://docs.djangoproject.com/en/4.2/howto/deployment/checklist/

# SECURITY WARNING: keep the secret key used in production secret!
SECRET_KEY = 'django-insecure-k)=rfq8qzy1bynbyxf#h&baf9^&6o32pjb!!9dp$wrf=5-6_w_'

# SECURITY WARNING: don't run with debug turned on in production!
DEBUG = True

ALLOWED_HOSTS = []


# Application definition

INSTALLED_APPS = [
    'django.contrib.admin',
    'django.contrib.auth',
    'django.contrib.contenttypes',
    'django.contrib.sessions',
    'django.contrib.messages',
    'django.contrib.staticfiles',
    'django_plotly_dash.apps.DjangoPlotlyDashConfig',
    'passionfruitapp',
]
X_FRAME_OPTIONS = 'SAMEORIGIN'

MIDDLEWARE = [
    'django.middleware.security.SecurityMiddleware',
    'django.contrib.sessions.middleware.SessionMiddleware',
    'django.middleware.common.CommonMiddleware',
    'django.middleware.csrf.CsrfViewMiddleware',
    'django.contrib.auth.middleware.AuthenticationMiddleware',
    'django.contrib.messages.middleware.MessageMiddleware',
    'django.middleware.clickjacking.XFrameOptionsMiddleware',
]

ROOT_URLCONF = 'passionfruitproj.urls'

TEMPLATES = [
    {
        'BACKEND': 'django.template.backends.django.DjangoTemplates',
        'DIRS': [os.path.join(BASE_DIR, 'templates')],
        'APP_DIRS': True,
        'OPTIONS': {
            'context_processors': [
                'django.template.context_processors.debug',
                'django.template.context_processors.request',
                'django.contrib.auth.context_processors.auth',
                'django.contrib.messages.context_processors.messages',
            ],
        },
    },
]

WSGI_APPLICATION = 'passionfruitproj.wsgi.application'


# Database
# https://docs.djangoproject.com/en/4.2/ref/settings/#databases

DATABASES = {
    'default': {
        'ENGINE': 'django.db.backends.sqlite3',
        'NAME': BASE_DIR / 'db.sqlite3',
    }
}


# Password validation
# https://docs.djangoproject.com/en/4.2/ref/settings/#auth-password-validators

AUTH_PASSWORD_VALIDATORS = [
    {
        'NAME': 'django.contrib.auth.password_validation.UserAttributeSimilarityValidator',
    },
    {
        'NAME': 'django.contrib.auth.password_validation.MinimumLengthValidator',
    },
    {
        'NAME': 'django.contrib.auth.password_validation.CommonPasswordValidator',
    },
    {
        'NAME': 'django.contrib.auth.password_validation.NumericPasswordValidator',
    },
]


# Internationalization
# https://docs.djangoproject.com/en/4.2/topics/i18n/

LANGUAGE_CODE = 'zh-Hant'

TIME_ZONE = 'Asia/Taipei'

USE_I18N = True

USE_TZ = True


# Static files (CSS, JavaScript, Images)
# https://docs.djangoproject.com/en/4.2/howto/static-files/

STATIC_URL = 'static/'

# Default primary key field type
# https://docs.djangoproject.com/en/4.2/ref/settings/#default-auto-field

DEFAULT_AUTO_FIELD = 'django.db.models.BigAutoField'

STATICFILES_DIRS = [
  os.path.join(BASE_DIR, 'static'),
 ]

3.修改urls.py程式

!-- HTML generated using hilite.me -->
 1
 2
 3
 4
 5
 6
 7
 8
 9
10
11
12
13
14
15
16
17
18
19
20
21
22
23
24
25
26
"""
URL configuration for passionfruitproj project.

The `urlpatterns` list routes URLs to views. For more information please see:
    https://docs.djangoproject.com/en/4.2/topics/http/urls/
Examples:
Function views
    1. Add an import:  from my_app import views
    2. Add a URL to urlpatterns:  path('', views.home, name='home')
Class-based views
    1. Add an import:  from other_app.views import Home
    2. Add a URL to urlpatterns:  path('', Home.as_view(), name='home')
Including another URLconf
    1. Import the include() function: from django.urls import include, path
    2. Add a URL to urlpatterns:  path('blog/', include('blog.urls'))
"""
from django.contrib import admin
from django.urls import path
from passionfruitapp.views import home
from django.conf.urls import include

urlpatterns = [
    path('admin/', admin.site.urls),
    path('', home),
    path('django_plotly_dash/', include('django_plotly_dash.urls')),
]

4.修改views.py

 1
 2
 3
 4
 5
 6
 7
 8
 9
10
11
12
13
14
15
16
17
18
19
20
21
22
23
24
25
26
27
28
29
30
31
32
33
34
35
36
37
38
39
40
41
42
43
44
from django.shortcuts import render
import pandas as pd
from dash import Dash, dcc, html
from django_plotly_dash import DjangoDash

# 創建交易數據
data = {
    '交易日期': ['085年', '086年', '087年', '088年', '089年', '090年', '091年', '092年', '093年', '094年',
                '095年', '096年', '097年', '098年', '099年', '100年', '101年', '102年', '103年', '104年',
                '105年', '106年', '107年', '108年', '109年', '110年', '111年', '112年'],
    '平均價': [24.8, 20.2, 24.1, 22.4, 23.1, 21.6, 22.3, 20.6, 22.9, 30.5, 25.5, 26.2, 26.7, 28.5, 29.7,
              24.8, 40.2, 39.8, 38.9, 37.1, 54.3, 48.8, 36.7, 47.4, 38.1, 43.0, 47.2, 54.2],
    '交易量': [1239371.0, 1648762.0, 1558996.0, 1759508.7, 1720805.0, 2162901.8, 2208902.0, 2150995.0,
              2157947.5, 2562379.4, 2840040.5, 2650637.8, 3195998.0, 3403571.0, 3570338.4, 4633125.5,
              4088659.4, 4525197.0, 6579937.4, 8522771.8, 8860383.9, 8916824.2, 11390231.7, 9734445.9,
              9878849.5, 8889654.6, 9334203.0, 3084173.7]
}

df = pd.DataFrame(data)
# 創建Dash應用
app = DjangoDash('PassionFruit')  # replaces dash.Dash

# 设置应用布局
app.layout = html.Div(children=[
    html.H1(children='百香果產品交易價量走勢圖'),
    dcc.Graph(
        id='price-volume-chart',
        figure={
            'data': [
                {'x': df['交易日期'], 'y': df['平均價'], 'type': 'line', 'name': '平均價', 'yaxis': 'y1'},
                {'x': df['交易日期'], 'y': df['交易量'], 'type': 'bar', 'name': '交易量', 'yaxis': 'y2'}
            ],
            'layout': {
                'title': '百香果產品交易價量走勢',
                'xaxis': {'title': '交易日期'},
                'yaxis': {'title': '平均價格', 'side': 'left', 'showgrid': False},
                'yaxis2': {'title': '交易量', 'side': 'right', 'showgrid': False, 'overlaying': 'y'},
            }
        }
    )
])

def home(request):
    return render(request, 'index.html', locals())

5.在passionfruitapp目錄下建立templates目錄,並新增一個index.html。

 1
 2
 3
 4
 5
 6
 7
 8
 9
10
11
<html>
<head>
{% load plotly_dash %}

</head>
<body>

    {% plotly_app name="PassionFruit" %}

</body>
</html>

執行結果:

很可惜沒看到全圖樣貌,但可以用右邊捲動軸來看圖。

用Python Dash畫出價格和交易量兩軸趨勢圖

水果類農產品代碼查詢: http://www.tapmc.com.taipei/Pages/Market/Fruit

農產品批發市場交易行情站:https://amis.afa.gov.tw/m_fruit/FruitChartProdTransPriceVolumeTrend.aspx

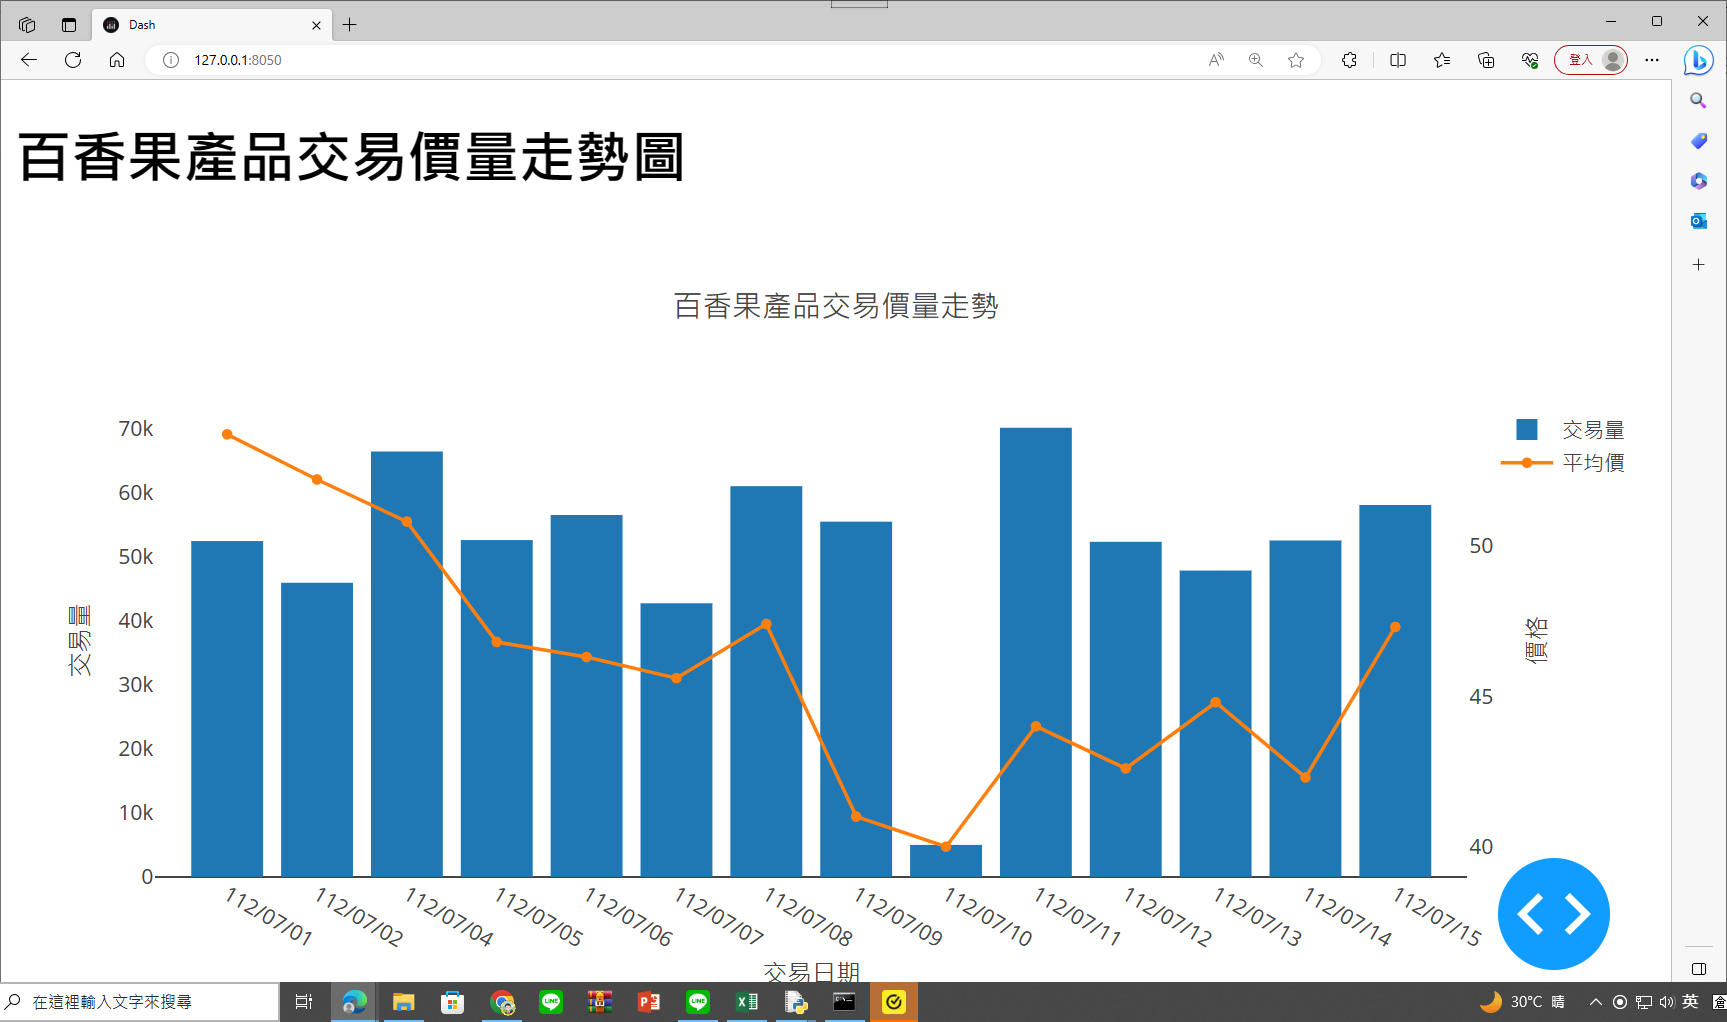
範例一:112/7/1-112/7/15百香果的交易情形

程式碼:

 1
 2
 3
 4
 5
 6
 7
 8
 9
10
11
12
13
14
15
16
17
18
19
20
21
22
23
24
25
26
27
28
29
30
31
32
33
34
35
36
37
38
39
40
41
import pandas as pd
from dash import Dash, dcc, html

# 創建交易數據
data = {
    '交易日期': ['112/07/01', '112/07/02', '112/07/04', '112/07/05', '112/07/06',
                '112/07/07', '112/07/08', '112/07/09', '112/07/10', '112/07/11',
                '112/07/12', '112/07/13', '112/07/14', '112/07/15'],
    '平均價': [53.7, 52.2, 50.8, 46.8, 46.3, 45.6, 47.4, 41.0, 40.0, 44.0, 42.6, 44.8, 42.3, 47.3],
    '交易量': [52451.5, 45936.6, 66436.0, 52604.5, 56520.7, 42734.7, 61024.5, 55481.1, 5000.0,
              70146.4, 52332.4, 47844.1, 52541.3, 58086.0]
}

df = pd.DataFrame(data)

# 創建Dash應用程式
app = Dash(__name__)

# 設置應用程式佈局
app.layout = html.Div(children=[
    html.H1(children='百香果產品交易價量走勢圖'),
    dcc.Graph(
        id='price-volume-chart',
        figure={
            'data': [
                {'x': df['交易日期'], 'y': df['交易量'], 'type': 'bar', 'name': '交易量', 'yaxis': 'y1'},
                {'x': df['交易日期'], 'y': df['平均價'], 'type': 'line', 'name': '平均價', 'yaxis': 'y2'}
            ],
            'layout': {
                'title': '百香果產品交易價量走勢',
                'xaxis': {'title': '交易日期'},
                'yaxis': {'title': '交易量', 'side': 'left', 'showgrid': False},
                'yaxis2': {'title': '價格', 'side': 'right', 'showgrid': False, 'overlaying': 'y'}
            }
        }
    )
])

# 運行應用程式
if __name__ == '__main__':
    app.run_server(debug=True)

執行結果:

範例二:85年至112年百香果的交易情形

 1
 2
 3
 4
 5
 6
 7
 8
 9
10
11
12
13
14
15
16
17
18
19
20
21
22
23
24
25
26
27
28
29
30
31
32
33
34
35
36
37
38
39
40
41
42
43
44
45
46
47
48
49
50
51
import pandas as pd
from dash import Dash, dcc, html

# 创建交易数据
data = {
    '交易日期': ['085年', '086年', '087年', '088年', '089年', '090年', '091年', '092年', '093年', '094年',
                '095年', '096年', '097年', '098年', '099年', '100年', '101年', '102年', '103年', '104年',
                '105年', '106年', '107年', '108年', '109年', '110年', '111年', '112年'],
    '平均價': [24.8, 20.2, 24.1, 22.4, 23.1, 21.6, 22.3, 20.6, 22.9, 30.5, 25.5, 26.2, 26.7, 28.5, 29.7,
              24.8, 40.2, 39.8, 38.9, 37.1, 54.3, 48.8, 36.7, 47.4, 38.1, 43.0, 47.2, 54.2],
    '交易量': [1239371.0, 1648762.0, 1558996.0, 1759508.7, 1720805.0, 2162901.8, 2208902.0, 2150995.0,
              2157947.5, 2562379.4, 2840040.5, 2650637.8, 3195998.0, 3403571.0, 3570338.4, 4633125.5,
              4088659.4, 4525197.0, 6579937.4, 8522771.8, 8860383.9, 8916824.2, 11390231.7, 9734445.9,
              9878849.5, 8889654.6, 9334203.0, 3084173.7]
}

df = pd.DataFrame(data)

# 創建Dash應用
app = Dash(__name__)

# 设置应用布局
app.layout = html.Div(children=[
    html.H1(children='百香果產品交易價量走勢圖'),
    dcc.Graph(
        id='price-volume-chart',
        figure={
            'data': [
                {'x': df['交易日期'], 'y': df['平均價'], 'type': 'line', 'name': '平均價', 'yaxis': 'y1'},
                {'x': df['交易日期'], 'y': df['交易量'], 'type': 'bar', 'name': '交易量', 'yaxis': 'y2'}
            ],
            'layout': {
                'title': '百香果產品交易價量走勢',
                'xaxis': {'title': '交易日期'},
                'yaxis': {'title': '平均價格', 'side': 'left', 'showgrid': False},
                'yaxis2': {'title': '交易量', 'side': 'right', 'showgrid': False, 'overlaying': 'y'},
                'annotations': [
                    {'x': date, 'y': price, 'text': '元/公斤', 'showarrow': False, 'xref': 'x', 'yref': 'y1'}
                    for date, price in zip(df['交易日期'], df['平均價'])
                ] + [
                    {'x': date, 'y': volume, 'text': '公斤', 'showarrow': False, 'xref': 'x', 'yref': 'y2'}
                    for date, volume in zip(df['交易日期'], df['交易量'])
                ]
            }
        }
    )
])

# 运行应用
if __name__ == '__main__':
    app.run_server(debug=True)

執行結果:


2023年7月14日 星期五

用Python程式來顯示百香果各市場交易箱形圖

以下是程式的解析流程:
  1. 導入必要的模組和套件,包括 requests 和 matplotlib.pyplot 用於發送 HTTP 請求和繪製圖表,以及 FontProperties 用於處理中文字型。
  2. 定義中文字型的檔案路徑,這是為了在圖表中正確顯示中文,請將其替換為你的中文字型檔案路徑。
  3. 透過 requests.get 方法發送 HTTP 請求獲取資料,並使用 response.json() 將回應轉換為 JSON 格式的資料。
  4. 創建一個空字典 markets 來儲存百香果在各市場的平均價格資料。
  5. 使用迴圈遍歷資料,如果作物名稱中包含 "百香果",則將該資料的市場名稱和平均價格提取出來。
  6. 將市場名稱作為鍵,將平均價格作為值,將它們添加到 markets 字典中。如果市場名稱已存在於字典中,則將該市場的平均價格附加到現有值的列表中,否則創建一個新的列表。
  7. 取得市場名稱列表 market_names 和對應的平均價格列表 market_prices。
  8. 使用 matplotlib.pyplot 繪製箱形圖,將 market_prices 的值作為資料繪製,並使用 market_names 作為 x 軸標籤。
  9. 設定圖表的標籤、標題和字型,包括 x 軸標籤、y 軸標籤、圖表標題、x 軸標籤的旋轉角度和字型、以及 y 軸字型。
  10. 使用 plt.tight_layout() 調整圖表佈局,以確保元素之間的間距正確。
  11. 顯示繪製的圖表。

 程式碼:

 1
 2
 3
 4
 5
 6
 7
 8
 9
10
11
12
13
14
15
16
17
18
19
20
21
22
23
24
25
26
27
28
29
30
31
32
33
34
35
36
37
38
39
40
41
import requests
import matplotlib.pyplot as plt
from matplotlib.font_manager import FontProperties

# 設置中文字體
font = FontProperties(fname='C:\Windows\Fonts\kaiu.ttf')

response = requests.get('https://data.coa.gov.tw/Service/OpenData/FromM/FarmTransData.aspx')
data = response.json()

markets = {}  # 市場名稱與價格的字典

# 收集百香果在各市場的平均價格資料
for row in data:
    if '百香果' in row['作物名稱']:
        market = row['市場名稱']
        price = row['平均價']
        
        if market in markets:
            markets[market].append(price)
        else:
            markets[market] = [price]

# 取得市場名稱列表
market_names = list(markets.keys())

# 取得每個市場的平均價格列表
market_prices = list(markets.values())

# 繪製圖表
plt.figure(figsize=(12, 6))

plt.boxplot(market_prices, labels=market_names)

plt.xlabel('市場名稱', fontproperties=font)  # 設定中文標籤
plt.ylabel('平均價格', fontproperties=font)  # 設定中文標籤
plt.title('百香果在各市場的平均價格分佈', fontproperties=font)  # 設定中文標題
plt.xticks(rotation=45, fontproperties=font)  # 設定 x 軸標籤旋轉角度和字型
plt.yticks(fontproperties=font)  # 設定 y 軸字型
plt.tight_layout()  # 調整圖表佈局
plt.show()

執行結果:


2023年7月12日 星期三

百香果Python程式設計-Matplotlib資料視覺化庫

 Matplotlib 是一個常用的 Python 資料視覺化庫,用於創建各種靜態、動態和互動式圖表。它提供了一個廣泛的功能,使用戶能夠製作出具有各種樣式和格式的高品質圖形。

Matplotlib 的主要特點包括:

  1. 簡單易用:Matplotlib 提供了直觀且簡單的 API,使得使用者能夠輕鬆地創建各種圖表。
  2. 多種圖表類型:Matplotlib 支援多種常用的圖表類型,包括折線圖、散點圖、柱狀圖、餅圖、直方圖等。
  3. 客製化能力:Matplotlib 允許使用者對圖表進行高度自定義,包括設置標籤、樣式、顏色、軸範圍、圖例等,以滿足用戶的特定需求。
  4. 支援多種輸出格式:Matplotlib 可以將圖表以多種常見的圖片格式保存,如 PNG、JPEG、SVG,也支援 PDF、EPS 等向量格式。
  5. 廣泛的互動功能:Matplotlib 提供了互動式功能,允許使用者進行縮放、平移、顯示數值等操作,並支援將圖表嵌入到 GUI 應用程式中。

以下是一個使用 Matplotlib 創建簡單折線圖的示例:

範例一:單折線圖

 1
 2
 3
 4
 5
 6
 7
 8
 9
10
11
12
13
14
15
16
17
18
19
20
import matplotlib.pyplot as plt
from matplotlib.font_manager import FontProperties

# 設置中文字體
font = FontProperties(fname='C:\Windows\Fonts\kaiu.ttf')

# 2022年百香果交易數量
months = ['1', '2', '3', '4', '5', '6', '7', '8', '9', '10', '11', '12']
quantity = [643003.8, 183158.4, 265054.6, 228489.7, 217712.4, 664609.9, 1435117.4, 1063251.8, 1242368.3, 1152853.3, 1273821.8, 964761.6]

# 創建折線圖
plt.plot(months, quantity)

# 設置標籤和標題
plt.xlabel('月份', fontproperties=font)
plt.ylabel('交易數量 (公斤)', fontproperties=font)
plt.title('2022年百香果交易情形', fontproperties=font)

# 顯示圖表
plt.show()

執行結果;


範例二:柱狀圖

 1
 2
 3
 4
 5
 6
 7
 8
 9
10
11
12
13
14
15
16
17
18
19
20
import matplotlib.pyplot as plt
from matplotlib.font_manager import FontProperties

# 設置中文字體
font = FontProperties(fname='C:\Windows\Fonts\kaiu.ttf')

# 2022年百香果交易數量
months = ['1', '2', '3', '4', '5', '6', '7', '8', '9', '10', '11', '12']
quantity = [643003.8, 183158.4, 265054.6, 228489.7, 217712.4, 664609.9, 1435117.4, 1063251.8, 1242368.3, 1152853.3, 1273821.8, 964761.6]

# 創建柱狀圖
plt.bar(months, quantity)

# 設置標籤和標題
plt.xlabel('月份', fontproperties=font)
plt.ylabel('交易數量 (公斤)', fontproperties=font)
plt.title('2022年百香果交易情形', fontproperties=font)

# 顯示圖表
plt.show()

執行結果:


範例三:雙折線圖

 1
 2
 3
 4
 5
 6
 7
 8
 9
10
11
12
13
14
15
16
17
18
19
20
21
22
23
24
25
import matplotlib.pyplot as plt
from matplotlib.font_manager import FontProperties

# 設置中文字體
font = FontProperties(fname='C:\Windows\Fonts\kaiu.ttf')

# 2022年百香果交易數量和平均價
months = ['1', '2', '3', '4', '5', '6', '7', '8', '9', '10', '11', '12']
quantity = [643003.8, 183158.4, 265054.6, 228489.7, 217712.4, 664609.9, 1435117.4, 1063251.8, 1242368.3, 1152853.3, 1273821.8, 964761.6]
avg_price = [31.3, 48.8, 59.1, 66.2, 65.5, 58.8, 48.4, 45.3, 47.1, 50.3, 44.0, 38.6]

# 創建折線圖
plt.plot(months, quantity, label='交易數量')
plt.plot(months, avg_price, label='平均價格')

# 設置標籤和標題
plt.xlabel('月份', fontproperties=font)
plt.ylabel('數量/價格', fontproperties=font)
plt.title('2022年百香果交易情形', fontproperties=font)

# 添加圖例並設置中文字體
plt.legend(prop=font)

# 顯示圖表
plt.show()

執行結果:


範例四:雙刻度的折線圖

 1
 2
 3
 4
 5
 6
 7
 8
 9
10
11
12
13
14
15
16
17
18
19
20
21
22
23
24
25
26
27
import matplotlib.pyplot as plt
from matplotlib.font_manager import FontProperties
# 設置中文字體
font = FontProperties(fname='C:\Windows\Fonts\kaiu.ttf')
# 2022年百香果交易數量和平均價
months = ['1', '2', '3', '4', '5', '6', '7', '8', '9', '10', '11', '12']
quantity = [643003.8, 183158.4, 265054.6, 228489.7, 217712.4, 664609.9, 1435117.4, 1063251.8, 1242368.3, 1152853.3, 1273821.8, 964761.6]
avg_price = [31.3, 48.8, 59.1, 66.2, 65.5, 58.8, 48.4, 45.3, 47.1, 50.3, 44.0, 38.6]
# 創建折線圖
fig, ax1 = plt.subplots()
# 設置第一個 y 軸(交易數量)
ax1.plot(months, quantity, label='交易數量', color='blue')
ax1.set_xlabel('月份', fontproperties=font)
ax1.set_ylabel('交易數量 (公斤)', fontproperties=font, color='blue')
ax1.tick_params(axis='y', colors='blue')
# 創建第二個 y 軸(平均價格)
ax2 = ax1.twinx()
ax2.plot(months, avg_price, label='平均價格', color='red')
ax2.set_ylabel('平均價格', fontproperties=font, color='red')
ax2.tick_params(axis='y', colors='red')
# 設置標題
plt.title('2022年百香果交易情形', fontproperties=font)
# 添加圖例
lines = [ax1.get_lines()[0], ax2.get_lines()[0]]
plt.legend(lines, [line.get_label() for line in lines], loc='best', prop=font)
# 顯示圖表
plt.show()

執行結果:


範例五:圓餅圖

 1
 2
 3
 4
 5
 6
 7
 8
 9
10
11
12
13
14
15
16
17
18
import matplotlib.pyplot as plt
from matplotlib.font_manager import FontProperties

# 設置中文字體
font = FontProperties(fname='C:\Windows\Fonts\kaiu.ttf')

# 2022年百香果交易數量
months = ['1', '2', '3', '4', '5', '6', '7', '8', '9', '10', '11', '12']
quantity = [643003.8, 183158.4, 265054.6, 228489.7, 217712.4, 664609.9, 1435117.4, 1063251.8, 1242368.3, 1152853.3, 1273821.8, 964761.6]

# 繪製圓餅圖
plt.pie(quantity, labels=months, autopct='%1.1f%%', startangle=90)

# 設置圖表標題
plt.title('2022年百香果交易數量比例', fontproperties=font)

# 顯示圖表
plt.show()

執行結果:


範例六:圓餅圖-交易額

 1
 2
 3
 4
 5
 6
 7
 8
 9
10
11
12
13
14
15
16
17
18
19
20
import matplotlib.pyplot as plt
from matplotlib.font_manager import FontProperties
# 設置中文字體
font = FontProperties(fname='C:\Windows\Fonts\kaiu.ttf')
# 2022年百香果交易數量和平均價格
months = ['1', '2', '3', '4', '5', '6', '7', '8', '9', '10', '11', '12']
quantity = [643003.8, 183158.4, 265054.6, 228489.7, 217712.4, 664609.9, 1435117.4, 1063251.8, 1242368.3, 1152853.3, 1273821.8, 964761.6]
avg_price = [31.3, 48.8, 59.1, 66.2, 65.5, 58.8, 48.4, 45.3, 47.1, 50.3, 44.0, 38.6]

# 計算交易額(交易數量 * 平均價格)
transaction_amount = [qty * price for qty, price in zip(quantity, avg_price)]

# 繪製圓餅圖
plt.pie(transaction_amount, labels=months, autopct='%1.1f%%', startangle=90)

# 設置圖表標題
plt.title('2022年百香果交易額比例', fontproperties=font)

# 顯示圖表
plt.show()

執行結果: