水果類農產品代碼查詢: http://www.tapmc.com.taipei/Pages/Market/Fruit
農產品批發市場交易行情站:https://amis.afa.gov.tw/m_fruit/FruitChartProdTransPriceVolumeTrend.aspx
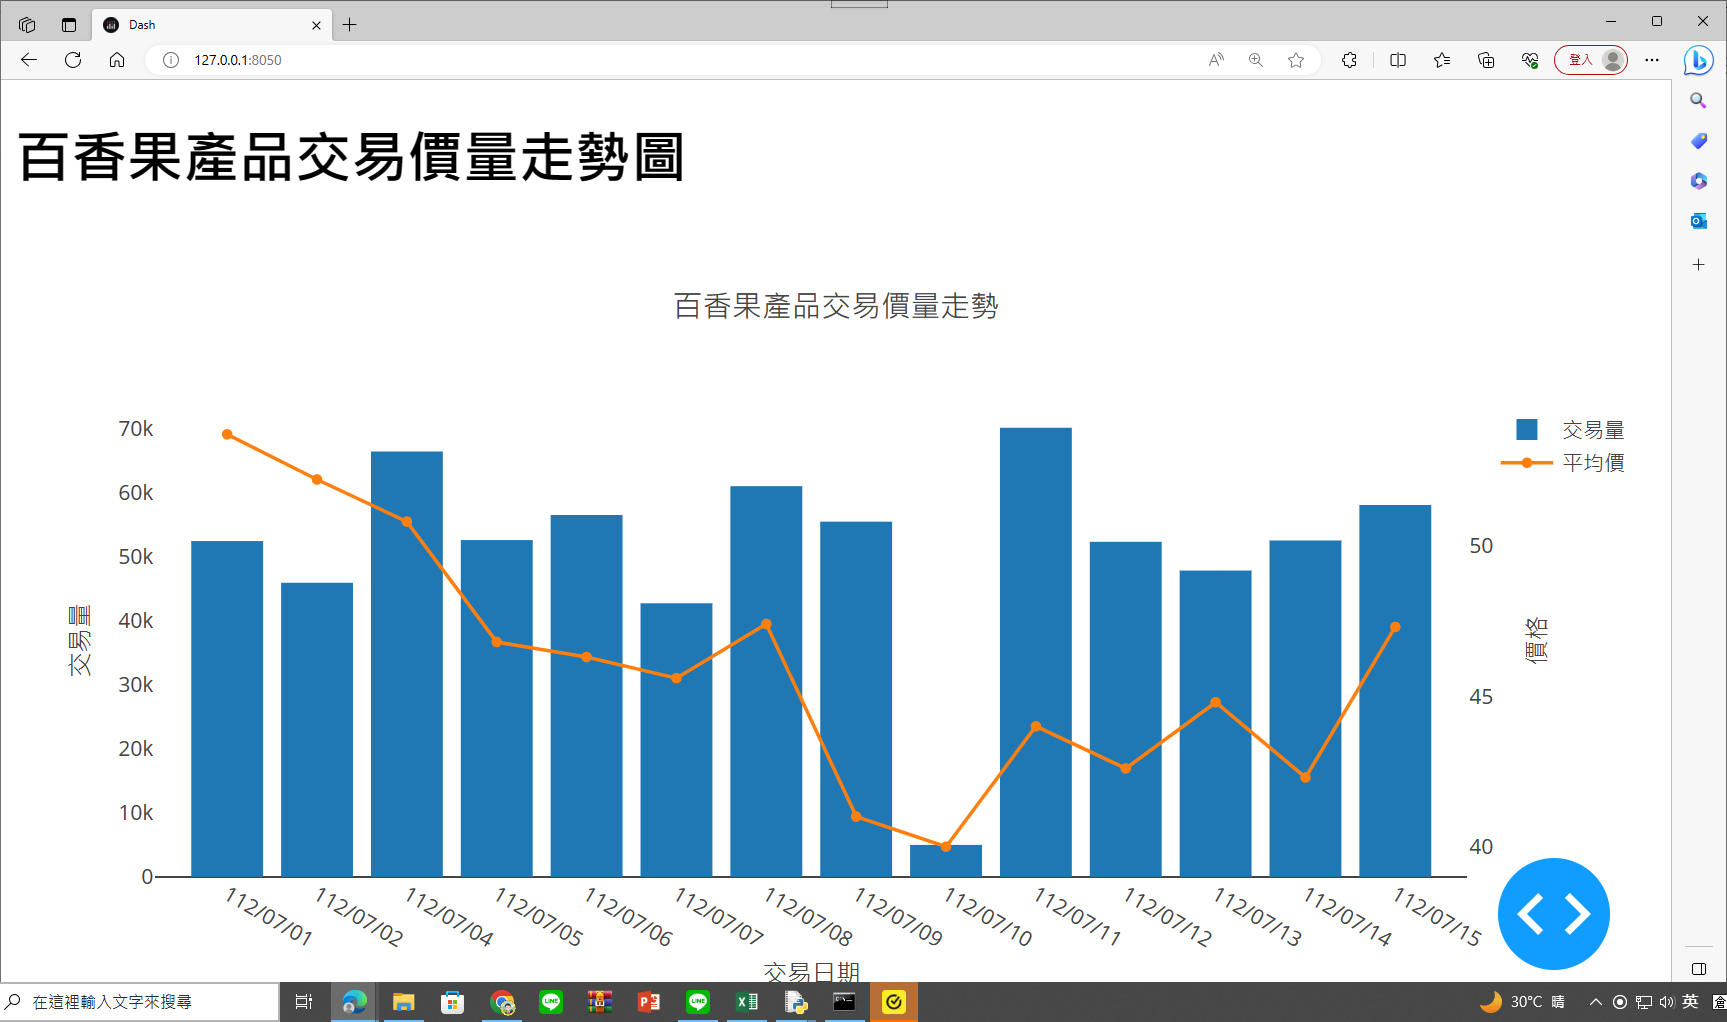
範例一:112/7/1-112/7/15百香果的交易情形
程式碼:
1 2 3 4 5 6 7 8 9 10 11 12 13 14 15 16 17 18 19 20 21 22 23 24 25 26 27 28 29 30 31 32 33 34 35 36 37 38 39 40 41 | import pandas as pd from dash import Dash, dcc, html # 創建交易數據 data = { '交易日期': ['112/07/01', '112/07/02', '112/07/04', '112/07/05', '112/07/06', '112/07/07', '112/07/08', '112/07/09', '112/07/10', '112/07/11', '112/07/12', '112/07/13', '112/07/14', '112/07/15'], '平均價': [53.7, 52.2, 50.8, 46.8, 46.3, 45.6, 47.4, 41.0, 40.0, 44.0, 42.6, 44.8, 42.3, 47.3], '交易量': [52451.5, 45936.6, 66436.0, 52604.5, 56520.7, 42734.7, 61024.5, 55481.1, 5000.0, 70146.4, 52332.4, 47844.1, 52541.3, 58086.0] } df = pd.DataFrame(data) # 創建Dash應用程式 app = Dash(__name__) # 設置應用程式佈局 app.layout = html.Div(children=[ html.H1(children='百香果產品交易價量走勢圖'), dcc.Graph( id='price-volume-chart', figure={ 'data': [ {'x': df['交易日期'], 'y': df['交易量'], 'type': 'bar', 'name': '交易量', 'yaxis': 'y1'}, {'x': df['交易日期'], 'y': df['平均價'], 'type': 'line', 'name': '平均價', 'yaxis': 'y2'} ], 'layout': { 'title': '百香果產品交易價量走勢', 'xaxis': {'title': '交易日期'}, 'yaxis': {'title': '交易量', 'side': 'left', 'showgrid': False}, 'yaxis2': {'title': '價格', 'side': 'right', 'showgrid': False, 'overlaying': 'y'} } } ) ]) # 運行應用程式 if __name__ == '__main__': app.run_server(debug=True) |
執行結果:
範例二:85年至112年百香果的交易情形
1 2 3 4 5 6 7 8 9 10 11 12 13 14 15 16 17 18 19 20 21 22 23 24 25 26 27 28 29 30 31 32 33 34 35 36 37 38 39 40 41 42 43 44 45 46 47 48 49 50 51 | import pandas as pd from dash import Dash, dcc, html # 创建交易数据 data = { '交易日期': ['085年', '086年', '087年', '088年', '089年', '090年', '091年', '092年', '093年', '094年', '095年', '096年', '097年', '098年', '099年', '100年', '101年', '102年', '103年', '104年', '105年', '106年', '107年', '108年', '109年', '110年', '111年', '112年'], '平均價': [24.8, 20.2, 24.1, 22.4, 23.1, 21.6, 22.3, 20.6, 22.9, 30.5, 25.5, 26.2, 26.7, 28.5, 29.7, 24.8, 40.2, 39.8, 38.9, 37.1, 54.3, 48.8, 36.7, 47.4, 38.1, 43.0, 47.2, 54.2], '交易量': [1239371.0, 1648762.0, 1558996.0, 1759508.7, 1720805.0, 2162901.8, 2208902.0, 2150995.0, 2157947.5, 2562379.4, 2840040.5, 2650637.8, 3195998.0, 3403571.0, 3570338.4, 4633125.5, 4088659.4, 4525197.0, 6579937.4, 8522771.8, 8860383.9, 8916824.2, 11390231.7, 9734445.9, 9878849.5, 8889654.6, 9334203.0, 3084173.7] } df = pd.DataFrame(data) # 創建Dash應用 app = Dash(__name__) # 设置应用布局 app.layout = html.Div(children=[ html.H1(children='百香果產品交易價量走勢圖'), dcc.Graph( id='price-volume-chart', figure={ 'data': [ {'x': df['交易日期'], 'y': df['平均價'], 'type': 'line', 'name': '平均價', 'yaxis': 'y1'}, {'x': df['交易日期'], 'y': df['交易量'], 'type': 'bar', 'name': '交易量', 'yaxis': 'y2'} ], 'layout': { 'title': '百香果產品交易價量走勢', 'xaxis': {'title': '交易日期'}, 'yaxis': {'title': '平均價格', 'side': 'left', 'showgrid': False}, 'yaxis2': {'title': '交易量', 'side': 'right', 'showgrid': False, 'overlaying': 'y'}, 'annotations': [ {'x': date, 'y': price, 'text': '元/公斤', 'showarrow': False, 'xref': 'x', 'yref': 'y1'} for date, price in zip(df['交易日期'], df['平均價']) ] + [ {'x': date, 'y': volume, 'text': '公斤', 'showarrow': False, 'xref': 'x', 'yref': 'y2'} for date, volume in zip(df['交易日期'], df['交易量']) ] } } ) ]) # 运行应用 if __name__ == '__main__': app.run_server(debug=True) |
執行結果:


沒有留言:
張貼留言